有趣的Python笔记Ⅳ_Matplotlib
Matplotlib
目录
[TOC]
依赖项
| 名称 | 用途 |
|---|---|
| Numpy | 科学计算库 |
| six | 实现Python2、3兼容性 |
| dateutil | 日期时间处理扩展 |
| pyparsing | 公式渲染功能拓展 |
| setuptools | 工具安装拓展 |
| libpng | PNG文件加载拓展 |
| pytz | 时区敏感的日期时间功能拓展 |
| preetype | truetype字体文件使用拓展 |
简介
参考R语言的pplot2,面向对象的绘图方式,过程式语法。
Matplotlib通过pyplot module提供一系列绘图API,相似的还有pylab module,它将函数导入Global Namespace以模仿MaLib,但由于同时大量导入Global Namespace会出现意外错误,因此不推荐使用。
Matplotlib的架构被逻辑性地分为三层。这三层逻辑可以视为一个栈。每层逻辑知道如何与其下的一层逻辑进行通信,但在下层逻辑看来,上层是透明的。这三层从底向上分别为:Canvas(后端)、Artist(美工)与pyplot(脚本)。
graph LR
    subgraph Root
    B["Canvas(后端)"]
    B-->B1("FigureCanvas(画布)")
    B-->B2("Renderer(渲染器)")
    B-->B3("Event(事件)")
    end
    subgraph Middle
    C["Artist(美工)"]
    C-->C1(("!Where"))
    C-->C2(("!What"))
    C-->C3(("!How"))
    end
    subgraph Top
    D["Pyplot(脚本)"]
    D-->D1(("!效果"))
    end
    subgraph Main
    A["Matplotlib"]
    end
    A--底层实现-->B
    A--中层计算-->C
    A--顶层封装-->D
Pyplot
编程范式
1、函数式绘图
plt.的是函数式绘图。它通过将数据参数传入pyplot类的静态方法中并调用方法,从而绘图。
对于绘制单个图形来说容易理解。
1 | import matplotlib.pyplot as plt |
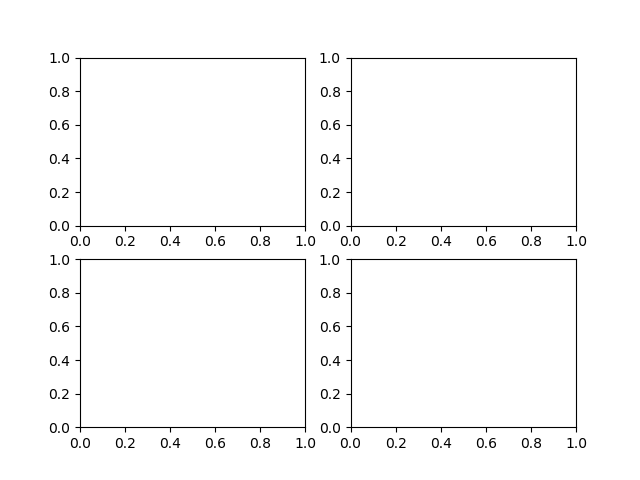
2、对象式编程
fig, ax = plt.subplots()是对象式绘图。plt.subplots()返回一个元组,包含Figure对象和Axes对象,前者控制画板属性,后者调整Figure中的Artists。
在绘制多个图形上操作较为简便。进行对象式绘图,首先通过plt.subplots()将Figure类和Axes类实例化为fig, ax,然后通过fig调整整体图片,通过ax绘制图形,设置坐标等。
1 | import matplotlib.pyplot as plt |
Parts of a Figure:
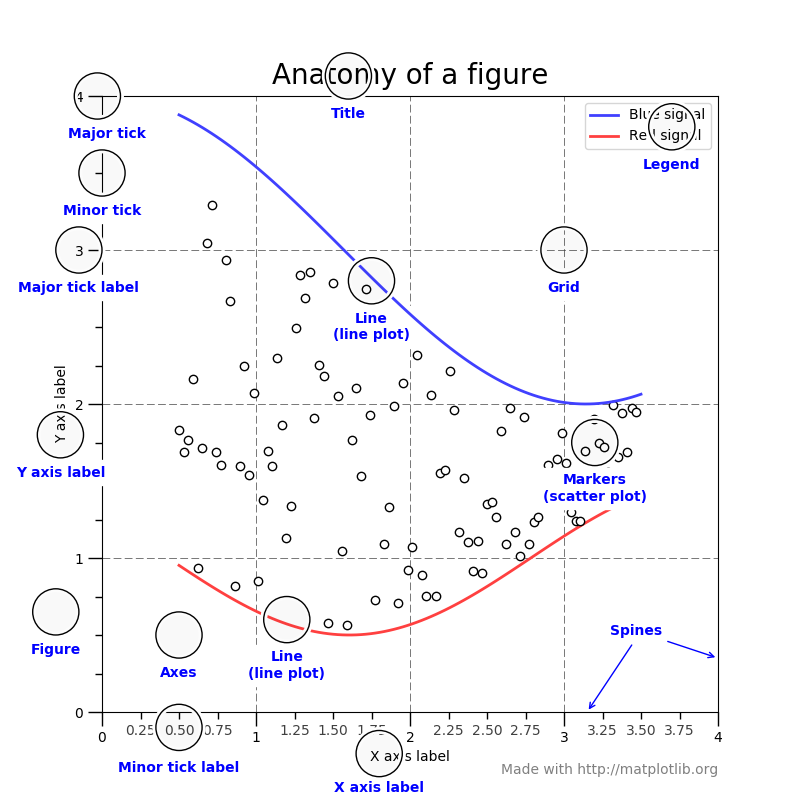
元素介绍
基本概念
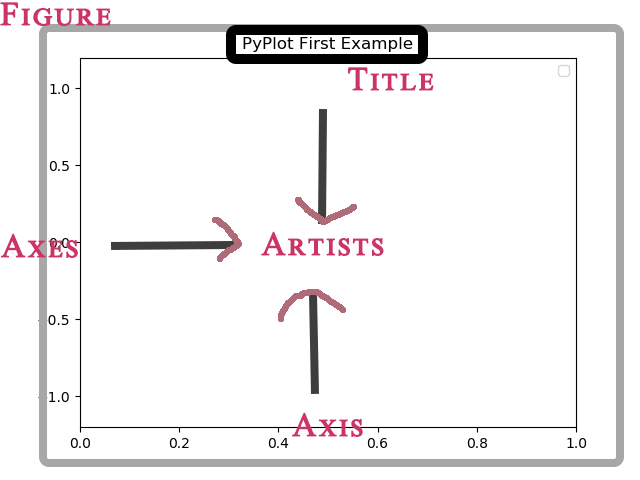
Figure:包括了所有Axis,Axes等元素的空间,个人视作一个画板。
Axes:子图,是包含数据空间的图像区域,包含2个及以上Axis。
Axis:坐标轴,限制数据范围,生成ticks和ticklabels。
Artists:在画板中看到的所有元素,大部分与Axis关联。
Primary
1 | import matplotlib.pyplot as plt |