网络结构上的SIR模型模拟
简介
网络无处不在。
自从1736年瑞士数学家欧拉(Leonhard Euler)孕育并使用图论解决了著名的哥尼斯堡七桥问题 后,图论的发展就陷入了停滞,直到20世纪50年代,保罗·埃尔德什(Paul Erdos)发表对随机图研究,图论才被重新建立起来。
网络,其实就是图。
不论是万维网、社交网,还是蛋白质表达网络、蟋蟀心跳在无控制下的同步,其内在机理都与网络密切相关。
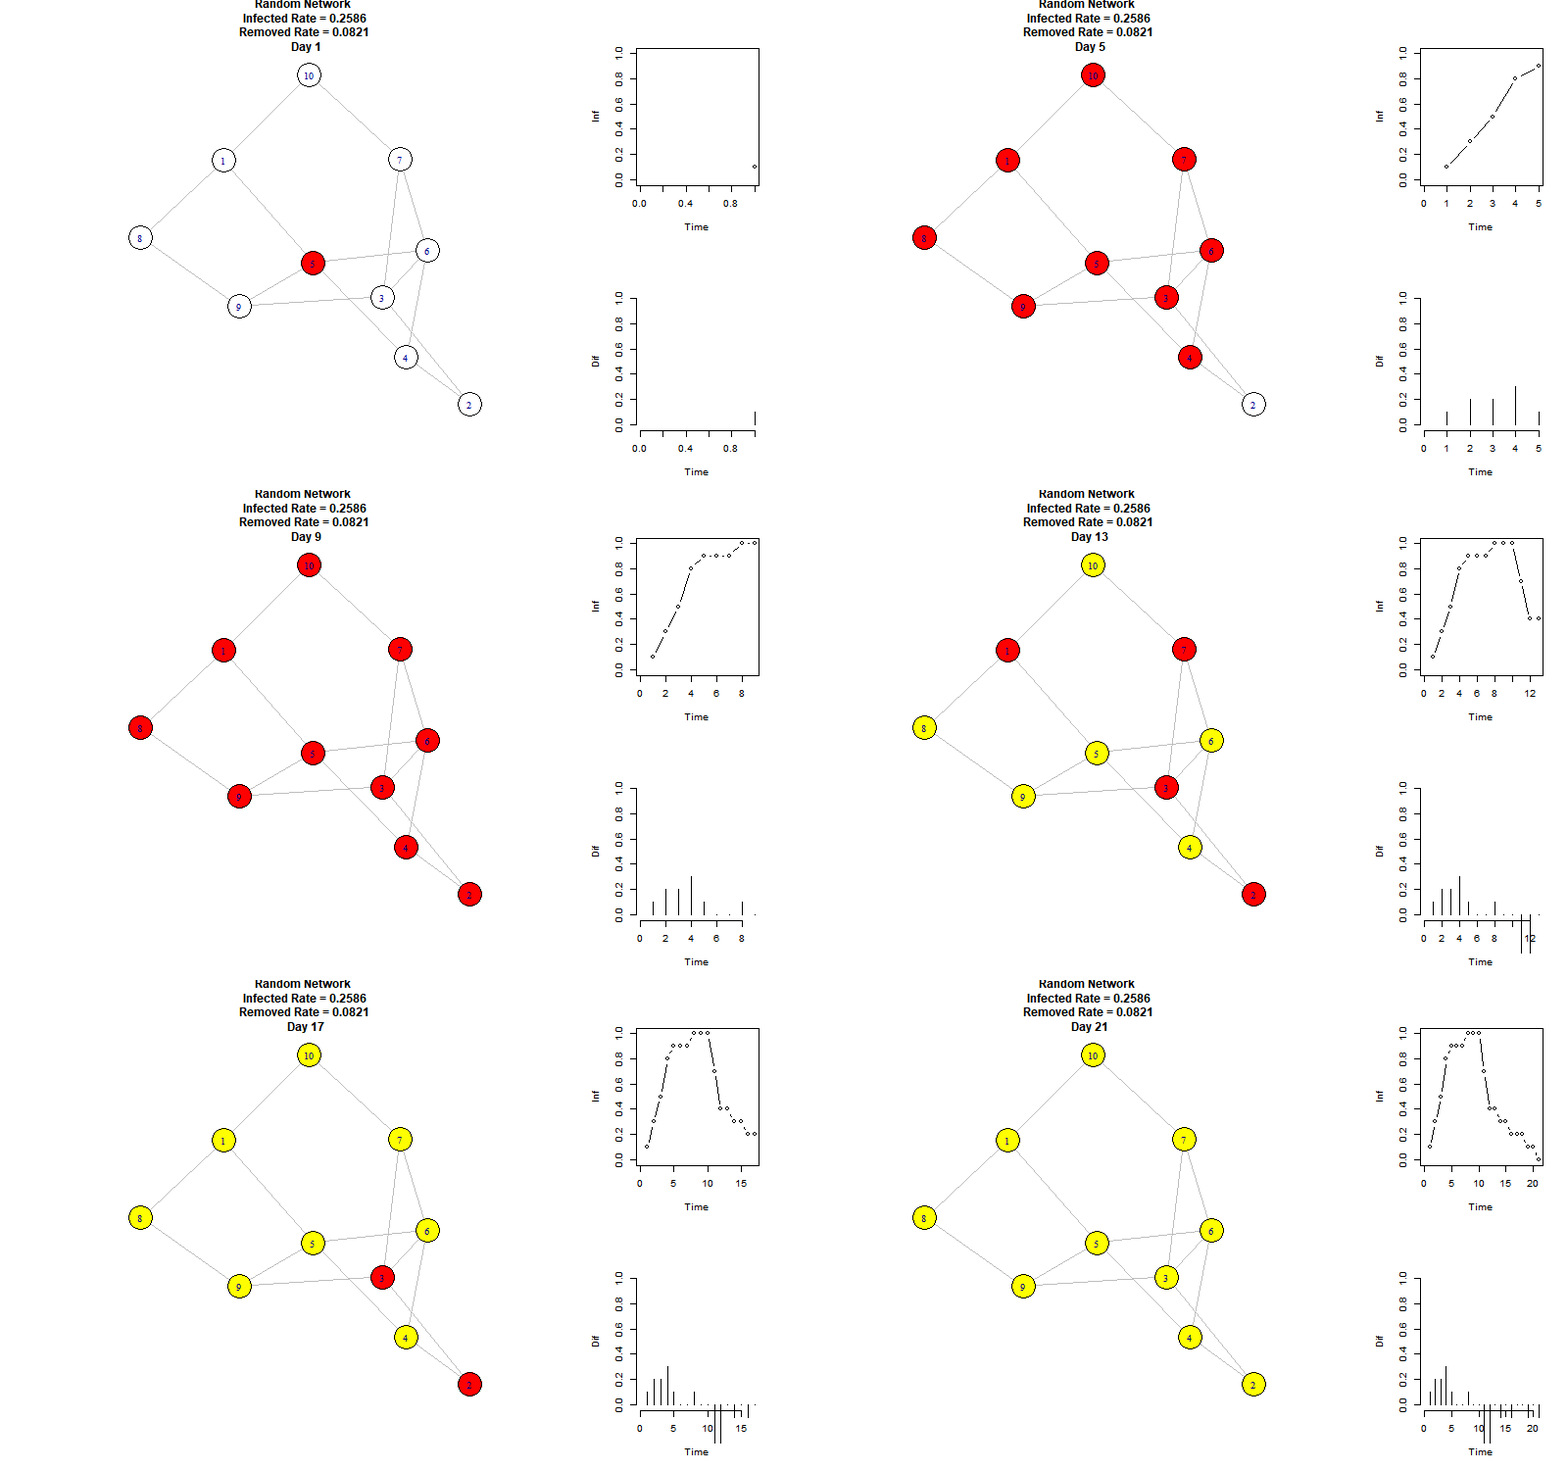
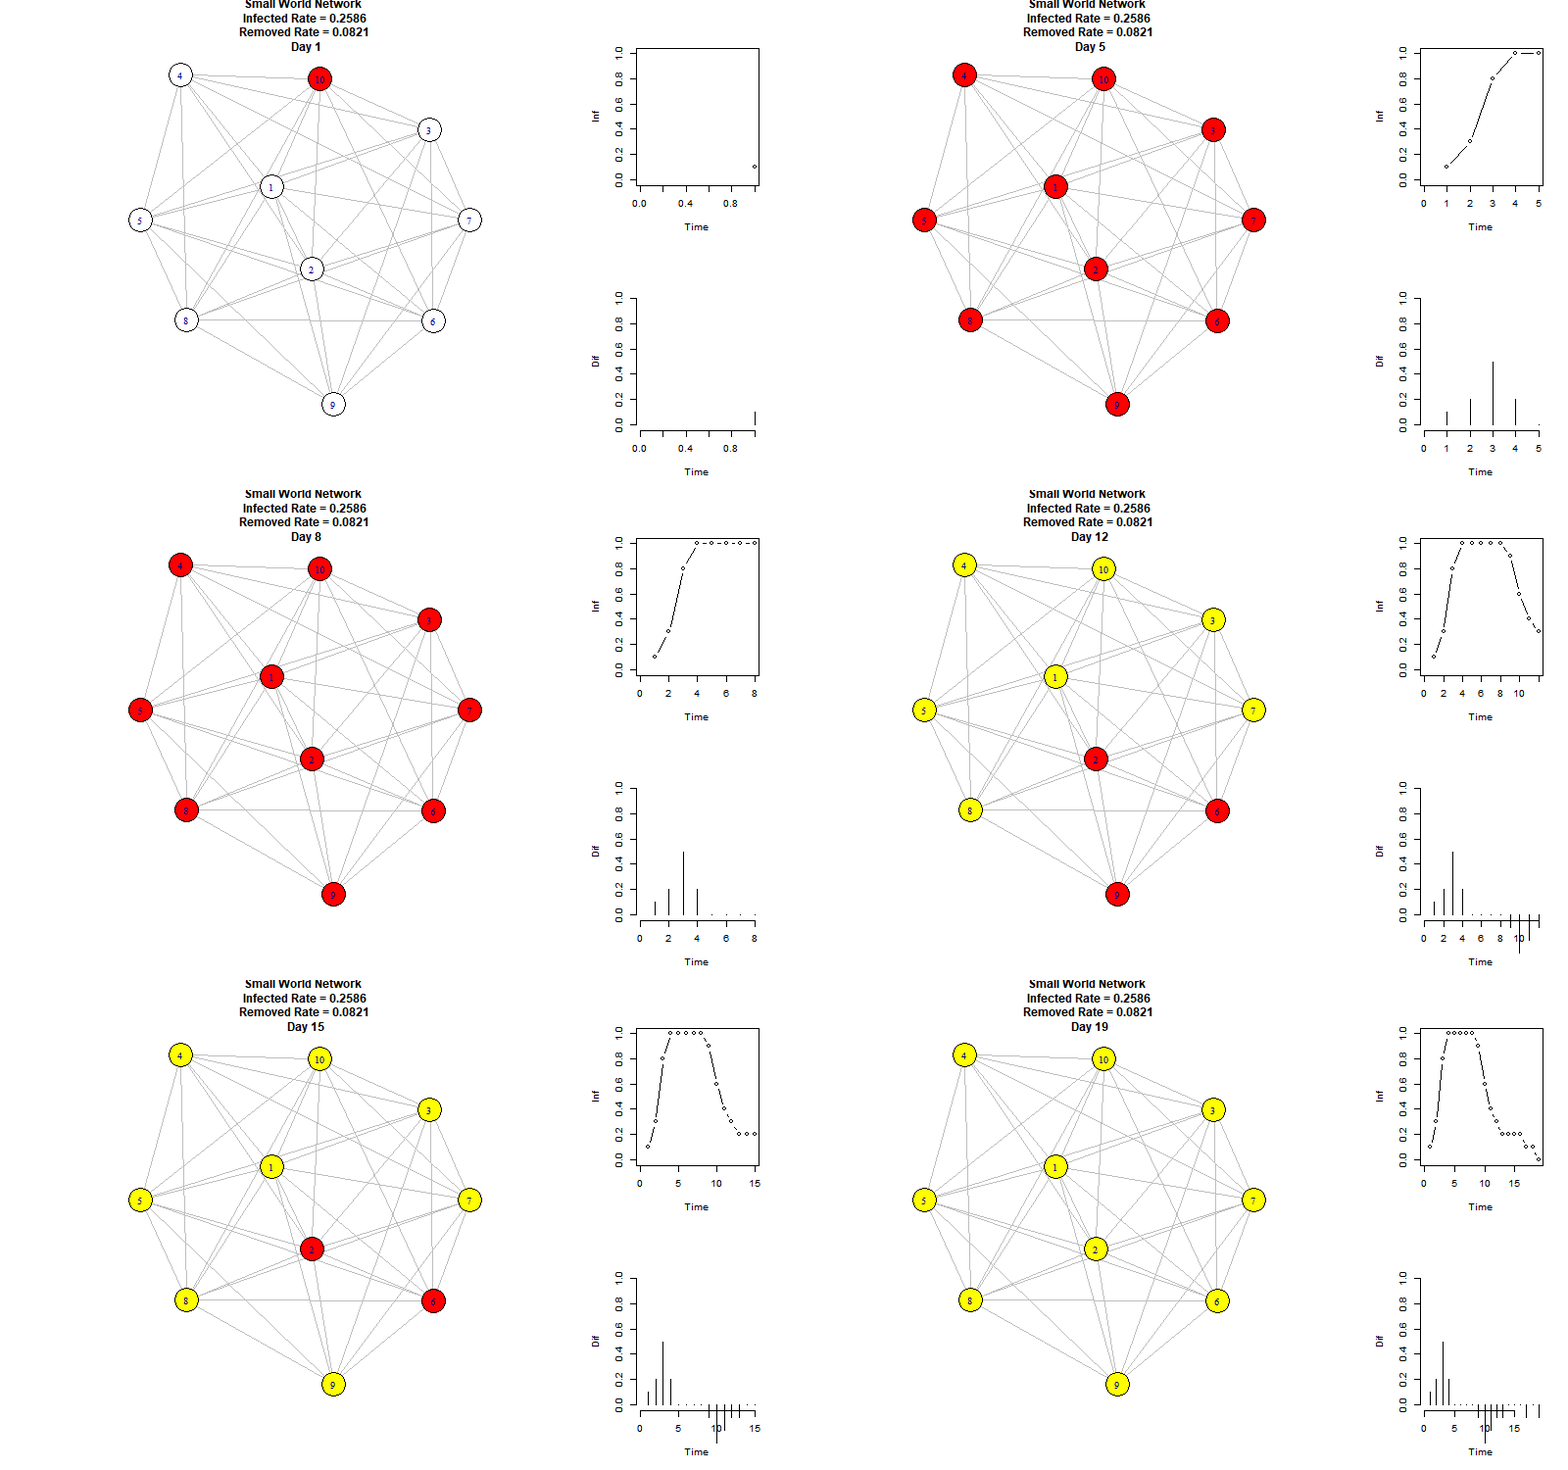
本篇在三个特殊的网络上模拟了传统的SIR模型,并探讨在不同的节点数量N下的感染峰值。
环境
R语言3.6.2 x64 + Rstudio
使用igraph和animation包,需要额外安装。
思路
graph TD
    A["设置参数及状态变量"] --> B["产生网络"]
    B --> C["初始化"]
    C --> D{"判断是否到达迭代终点"}
    D --"False"--> E["更新该时刻感染节点"]
    E --> F["取出到期的潜伏期节点,更新潜伏期节点序列"]
    F --> G{"判断取出的到期节点是否可以被治愈"}
    G --"True"--> H["治愈节点加入该时刻治愈节点序列"]
    H --> I["从该时刻感染节点中删去治愈节点"]
    I --> J["更新时刻"]
    G --"False"--> K["空节点加入该时刻治愈节点序列"]
    J --> D
    K --> I
    D --"True"--> L["打印GIF图"]
    L --> M("结束")
代码
让我们看看网络传染病在没有控制 的情况下会怎样发展。
参数及状态变量设置
以下代码将设置模拟的基本参数,包括节点数量、潜伏期时间、感染率、治愈率(或死亡率)、模拟时间、状态初始值等。
1 2 3 4 5 6 7 8 9 10 11 12 13 14 15 16 17 18 19 20 21 N = 100 TIME = 70 I = 1 R = 0 S = N - I - R InfectedRate = 0.2586 RemovedRate = 0.0821 Time_Infected = 10 Time_Removed = 6 Inf_porb = c(InfectedRate, 1 -InfectedRate) Rem_prob = c(RemovedRate, 1 -RemovedRate)
接下来我们设置在程序中记录节点状态的变量:
其实使用类来编程更为轻松和易懂,但是遗憾的是笔者并未深入学习R语言的这方面内容。就像MATLAB擅长于矩阵运算一样,R语言是为统计设计的语言。
1 2 3 4 5 6 7 8 9 10 11 TotalInfected = 1 Removed_list = NULL infected_list = NULL TimeLine_Infected = NULL TimeLine_Removed = NULL
网络产生
产生指定网络:
随机网络(Erdos-Renyi方法),自然界中几乎没有网络结构是随机的,因此随机网络更多是作为一个基准来研究其他结构化的网络。
小世界网络(Watts-Strogatz算法),其熵值在规则网络和随机网络之间。小世界效应:随着少数随机链路加入有结构的网络上,其平均路径长度会快速减少。这个效应导致了“六度分隔”,即世界上的任意两个人能够通过约六个人建立联系。
无标度网络(Barabasi-Albert方法)其度序列服从\(h(k)=k^{-q}\) 的幂律分布。简单说来,就是少量高度节点(hub)和大量低度节点。
1
2
3
4
5
6
7
8
9
10
11
12
13
14
15
library (igraph)g = erdos.renyi.game(N, 100 , type = "gnm" , loops = "TRUE" ) graph_name = "Random Network"
函数定义
定义一些函数:
随机选择函数:用于对序列按照一定概率进行状态(S、I、R)的选择。
更新感染者函数
更新治愈者函数
按时间序列绘图的函数:绘出从第1个时间单位到最后一个时间单位的图
生成GIF图的函数
随机选择函数
1 2 3 4 5 6 7 8 9 10 11 12 13 14 15 16 17 18 19 20 21 22 toss_Inf = function (freq) { tossing = NULL for (i in 1 :freq ) tossing[i] = sample(c(1 , 0 ), 1 , rep=TRUE , prob=Inf_porb) tossing = sum(tossing) return (tossing) } toss_Rem = function (freq) { tossing = NULL for (i in 1 :freq) tossing[i] = sample(c(1 ,0 ), 1 , rep=TRUE , prob=Rem_prob) tossing = sum(tossing) return (tossing) }
更新感染者函数
1 2 3 4 5 6 7 8 9 10 11 12 13 14 15 16 update_infected = function (infected, total_time) { nearest_neighbors = data.frame(table(unlist(neighborhood(g, 1 , infected)))) nearest_neighbors = subset(nearest_neighbors, !(nearest_neighbors[,1 ]%in %infected)) nearest_neighbors = subset(nearest_neighbors, !(nearest_neighbors[,1 ]%in %Removed_list[[total_time]])) keep = unlist(lapply(nearest_neighbors[,2 ], toss_Inf)) new_infected = as.numeric(as.character(nearest_neighbors[,1 ][keep >= 1 ])) infected = unique(c(infected, V(g)[new_infected])) return (infected) }
更新治愈者函数
1 2 3 4 5 6 7 8 9 10 11 12 13 14 15 16 17 update_removed = function (wait_removed, day) { wait_removed = data.frame(table(unlist(V(g)[wait_removed]))) push = unlist(lapply(wait_removed[,2 ], toss_Rem)) new_removed = as.numeric(as.character(wait_removed[,1 ][push >= 1 ])) if (length(Removed_list[[day]]) == 0 && length(new_removed) == 0 ) { Removed_list[[day+1 ]] = V(g)[0 ] }else { Removed_list[[day+1 ]] = c(Removed_list[[day]], V(g)[new_removed]) } return (Removed_list) }
打印图片函数
1 2 3 4 5 6 7 8 9 10 11 12 13 14 15 16 17 18 19 20 21 22 23 24 25 26 27 28 29 30 31 32 33 34 35 plot_time_series = function (infected_list, Removed_list, total_time){ num_inf = unlist(lapply(1 :total_time, function (x) length(infected_list[[x]]))) p_inf = num_inf / N p = diff(c(0 , p_inf)) time = 1 :total_time plot(p_inf~time, type = "b" , ylab = "Inf" , xlab = "Time" , xlim = c(0 ,total_time), ylim =c(0 ,1 )) plot(p~time, type = "h" , frame.plot = FALSE , ylab = "Dif" , xlab = "Time" , xlim = c(0 ,total_time), ylim =c(0 ,1 )) } plot_gif = function (infected_list, Removed_list){ d = 1 while (d <= length(infected_list)){ layout(matrix(c(1 , 2 , 1 , 3 ), 2 ,2 , byrow = TRUE ), widths=c(3 ,1 ), heights=c(1 , 1 )) V(g)$color = "white" V(g)$color[V(g)%in %infected_list[[d]]] = "red" V(g)$color[V(g)%in %Removed_list[[d]]] = "yellow" plot(g, layout =layout.old, edge.arrow.size=0.2 ) title(paste(graph_name, "\n Infected Rate =" , InfectedRate, "\n Removed Rate =" , RemovedRate, "\n Day" , d)) plot_time_series(infected_list, Removed_list, d) d = d + 1 } }
模拟开始
1 2 3 4 5 6 7 8 9 10 11 12 13 14 15 16 17 18 19 20 21 22 23 24 25 26 27 28 29 30 31 32 33 34 35 36 37 38 39 40 41 42 43 44 45 46 47 48 49 50 51 52 53 54 55 56 57 58 59 60 61 set.seed(138497 ) infected = sample(V(g), I) infected_list = list() TimeLine_Infected = list() Removed_list = list() Removed_list[[1 ]] = V(g)[0 ] for (i in 1 :Time_Infected) { TimeLine_Infected[[i]] = V(g)[0 ] } infected_list[[1 ]] = infected TimeLine_Infected[[Time_Infected]] = infected E(g)$color = "grey" V(g)$color = "white" set.seed(13413 ) layout.old = layout.fruchterman.reingold(g, niter = 1000 ) V(g)$color[V(g)%in %infected] = "red" plot(g, layout =layout.old) wait_removed = NULL total_time = 1 while (total_time < TIME){ infected_list[[total_time+1 ]] = update_infected(infected_list[[total_time]], total_time) wait_removed = c(wait_removed, TimeLine_Infected[[1 ]]) for (i in 2 :length(TimeLine_Infected)) { TimeLine_Infected[[i-1 ]] = TimeLine_Infected[[i]] } TimeLine_Infected[[Time_Infected]] = subset(infected_list[[total_time+1 ]], !infected_list[[total_time+1 ]]%in %infected_list[[total_time]]) if (length(wait_removed) != 0 ) { Removed_list = update_removed(wait_removed, total_time) }else { Removed_list[[total_time+1 ]] = Removed_list[[total_time]] } infected_list[[total_time+1 ]] = subset(infected_list[[total_time+1 ]], !infected_list[[total_time+1 ]]%in %Removed_list[[total_time+1 ]]) wait_removed = subset(wait_removed, !wait_removed%in %Removed_list[[total_time+1 ]]) TotalInfected = length(infected_list[[total_time+1 ]]) total_time = total_time + 1 } library (animation)saveGIF({ ani.options("convert" ) plot_gif(infected_list, Removed_list) }, ani.width = 800 , ani.height = 500 )
结论
我猜大部分读者会跳过代码部分,不过或许有一些初学者会希望自己重现这个过程,笔者也曾经是初学者,对于查找资料时看到的毫无注释和运行环境的代码十分头疼,所以还是给上述较为混乱的代码写了些注释。
这里需要说明,这个模拟是有很大局限的,现实世界中的许多影响因素不能很好地考虑进去。为方便理解和操作,这里说明影响结果的主要因素:
种子(seed):种子影响随机数生成过程,进而影响按概率选择、随机选择初始感染节点这两个过程。
节点规模(N)
状态转移概率(InfectedRate & RemovedRate):影响节点易感、感染和治愈之间转移的概率。
潜伏期时间(Time_Infected)
模拟时间(TIME)
网络生成参数
虽然已经说过这是在没有控制下的模拟,但是封路、口罩、消毒、医疗、政策影响、人自身主观能动性等因素可以通过“合理”调整状态转移概率 和网络生成参数 来达成。
至理名言:你的数学水平是永远也不够的。。。。。
要是笔者有更高的数学水平就不搞简单的模型了。。。
对于网络结构的说明
下面对于网络生成参数 作简单的说明:
随机网络:
1
2
g = erdos.renyi.game(N, 100 , type = "gnm" , loops = "TRUE" )
有两种生成模式:gnm、gnp。首先确定节点数量n,之后可以以连接两个任意节点的概率p 和总边数m 来构造。
随机网络的平均度(平均每个结点连接了多少条边)为:\(avg\_degree=2m/n=np\) 。
当节点数量非常大时,其度序列服从泊松分布。
小世界网络:
1 g = watts.strogatz.game(1 , N, 3 , 0.2 )
第一个参数由于笔者还没搞懂所以就不解释了;第二个参数表示节点数量;第三个参数表示每个结点与多少个直接后继节点 相邻;第四个参数表示重连概率,即前面三个参数构造好k-规则网络,再按第四个参数所规定的概率随机重连每条边。
无标度网络:
1 g = barabasi.game(N, power = 1 )
用非数学的语言来描述,就是具有少量高度节点(Hub)(即连接到该节点的链路较多),大量低度节点的网络。
第一个参数表示节点数量;第二个参数表示偏好链接,其意义为:构造过程中,将新的节点连接到第i个节点的概率P为:\(P(i)=\frac{k_i}{\sum_jk_j}\) ,\(k_i\) 为第i个节点的连通性。(但是笔者没有查询到power是如何应用进去的)
简单的例子
我们以随机网络为例:
1 2 3 4 5 6 7 8 N=10 ; TIME = 50 I = 1 ; R = 0 ; S = N - I - R InfectedRate = 0.2586 RemovedRate = 0.0821 Time_Infected = 7 g = erdos.renyi.game(N, 0.3 )
通过设置连接概率为0.3,使得每个结点平均连接了\(Np=3\) 个节点。
以下是模拟动图:
右上折线图表示每个时刻的感染节点比例,右下柱状图表示每个时刻增加的感染节点比例。
可以看到,当前参数下的感染峰值为100%,再第8个时间单位达到。
为啥不能聚餐拜年
让我们来看看疫情下的家庭聚餐。
假设你在一个大家庭里,亲戚往来平凡,过年总是有近20个男女老少聚在一起庆祝。你们聚餐时不戴口罩(。。。),在一起玩了1天。
然而,有一位“潜伏者”在你们之中……
TIME表示时间单位,其单位并不一定是天(day)。
1
2
3
4
5
6
7
8
9
N = 20 ; TIME = 50 I = 1 ; R = 0 ; S = N - I - R InfectedRate = 0.2586 RemovedRate = 0.0821 Time_Infected = 7 g = watts.strogatz.game(1 , N, 4 , 0.1 )
可以看到,第4个时间单位,感染峰值就达到了100%。这个时间单位,可以代表2小时,可以代表1小时,也可以代表1分钟。。。
事实上,如果在空气流通较差的环境下,感染峰值出现的速度会更加快。
为啥进商场要戴口罩
话不多说,上图:
节点分布太密了。。。其实主要看右侧统计图就好
假设商场有2层,每层面积\(1500m^2\) ,根据《全国民用建筑工程设计技术措施2009 规划·建筑·景观》视作地上3层(数字太大了笔记本承受不起。。。),所以商场共有2310人。使用平均度约为18的随机网络。
如果大家每天都去1个商场逛1-2小时,并且都不戴口罩,持续一个星期后,后果很严重。当然,模拟具有人流量和许多影响因素的商场误差还是很大的。
读者还可以自己模拟在不同的参数下,网络感染峰值会在怎样变化,从而得到防止疫情进一步发展的方向。
通过上述方法,我们还可以研究网络的平均度 、谱半径 等属性对于感染峰值的影响,这里就不在赘述了。
笔者又用代码水了一章,嘿嘿嘿。。。
参考文献
《网络科学:原理与应用》Ted G. Lewis著, 机械工业出版社, 2013年7月第1版
代码参考:http://www.sohu.com/a/144490909_826434 5


